Introducing ANIE Interactive
Active nutrition intelligence platform.
Search, filter, and analyse millions of data points across products, ingredients, categories, pricing, brands, flavours, and markets.
- Research your category
- Understand your competition
- Discover new opportunities
Trusted by leaders across the active nutrition industry























Introducing the ANIE Interactive
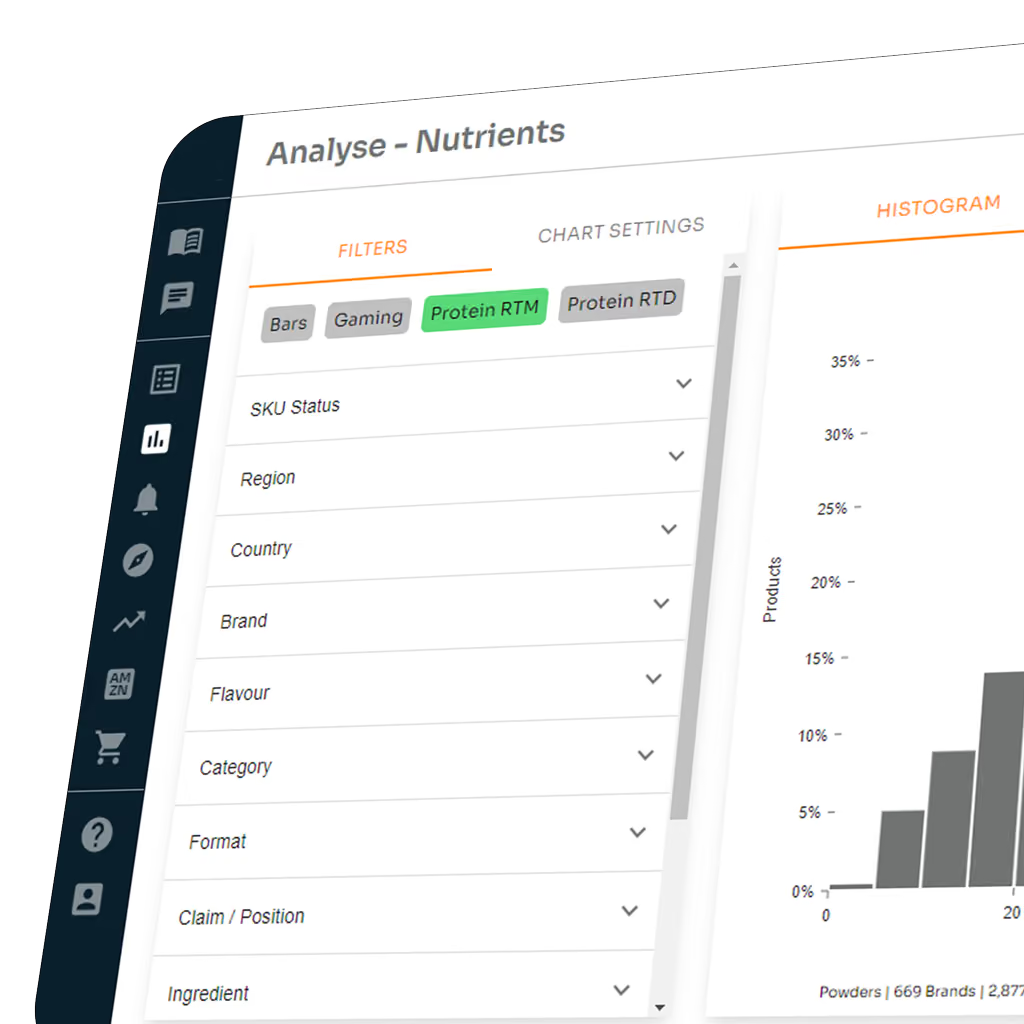
ANIE Interactive is the most comprehensive active nutrition data platform on the market. Search, filter, and analyse millions of data points across markets, brands, products, ingredients, categories, pricing and flavours to keep on top of emerging trends and uncover insights to stay ahead of the competition
Make decisions based on an unparalleled level of data

+25k
Products tracked globally
+50k
Individual SKUs tracked online
+5k
Brands across multiple categories
+40k
Countries monitored for changes
Critical data for every part of the value chain
For brands
Search, filter, and analyse millions of data points across markets, products, ingredients, pricing and flavour to understand clear consumer trends and make more informed portfolio decisions.
- Identify emerging opportunities
- Benchmark competitors
- Track product launches
- Optimise pricing strategies
For manufacturers
Access global market intelligence to anticipate customer demand, support innovation, and align production capabilities with evolving market needs.
- Understand high-growth formats
- Inform conversations with data
- Prioritise investment
- Transform your capacity planning
For suppliers
Track ingredient trends and category evolution to identify high growth areas, uncover commercial opportunities, and position your solutions in high-demand markets.
- Monitor ingredient adoption
- Track usage and trends
- Identify brand opportunities
- Benchmark competitor activity
Explore every angle of the active nutrition market
Unparalleled data set
Track data from over 50k SKUs, across 25k global products and +5k brands
Global market visibility
Track trends across countries & retailers to see where opportunities are emerging
Competitor intelligence
Monitor activity, launches and positioning to benchmark performance
Faster innovation
Validate ideas with real market evidence to accelerate development
Powerful custom filtering
Analyse and filter data to answer specific business/market questions
Export your queries
Once you have your data set, easily export it into spreadsheet format

Track the data most important to your business
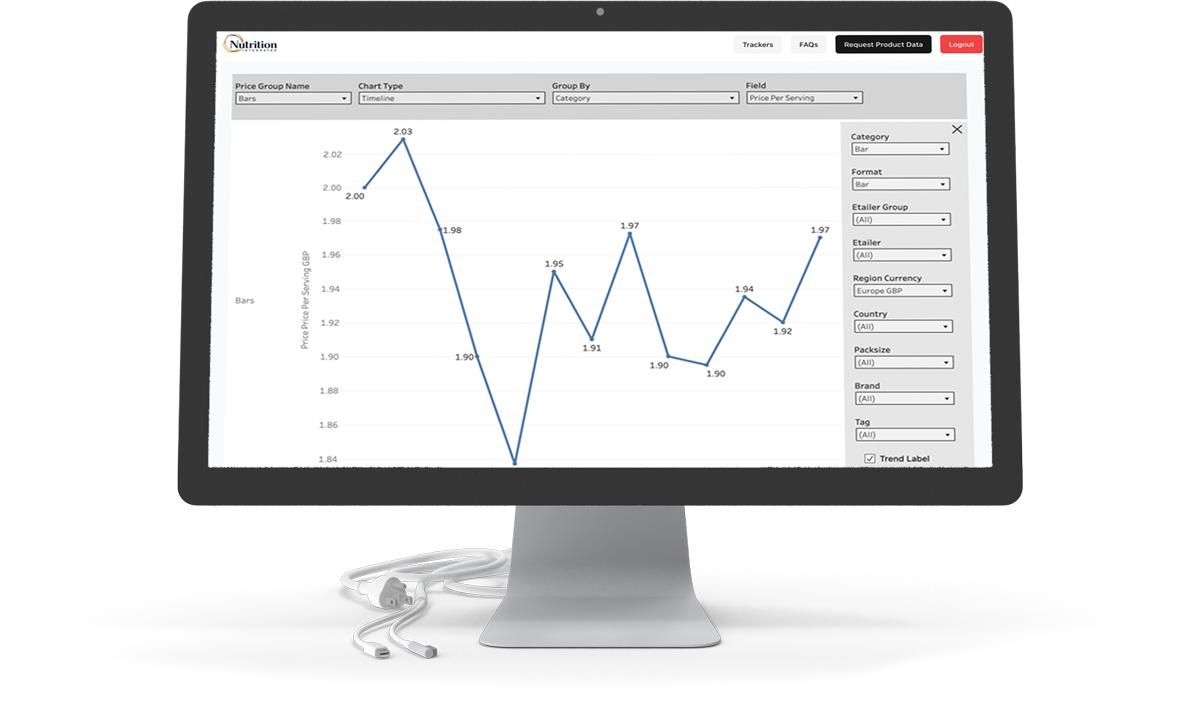
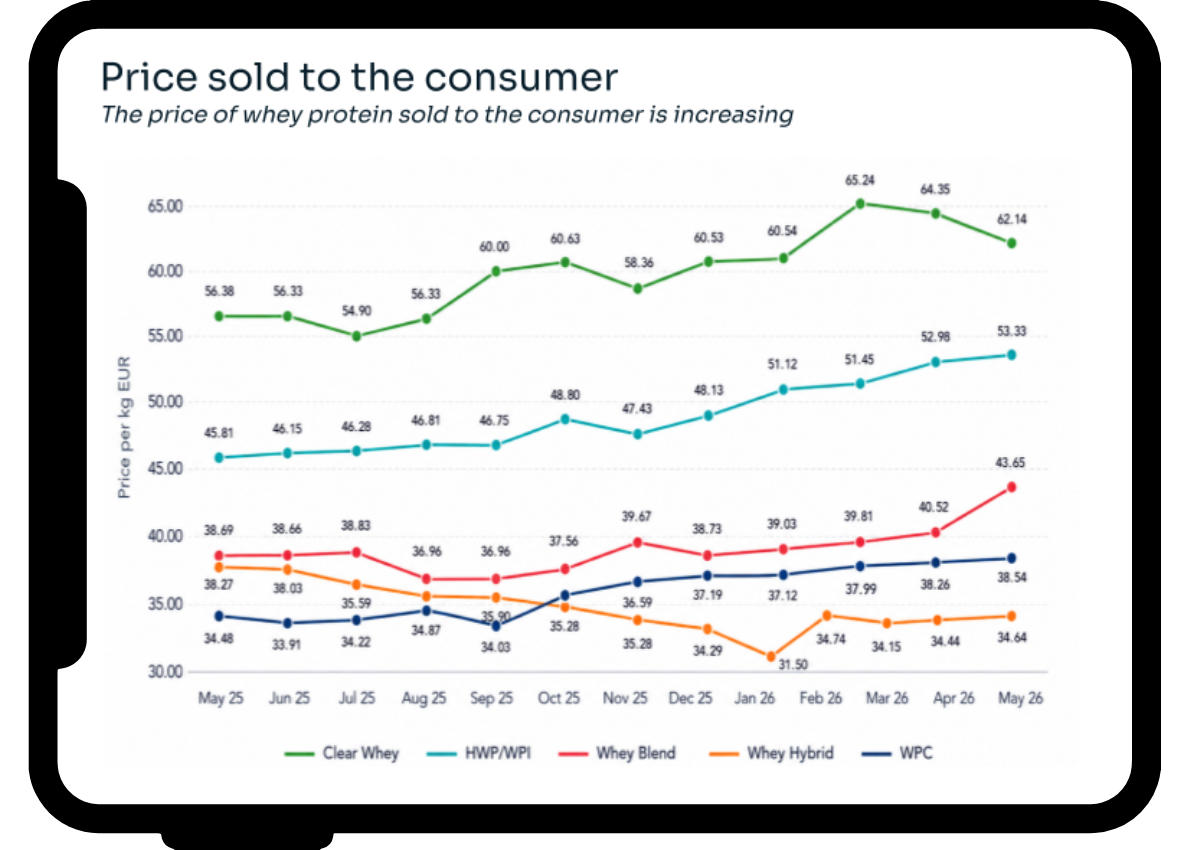
Monitor price movements across products, retailers and global markets to understand market positioning, benchmark competitors and identify emerging pricing trends before they impact your strategy.
Pricing can be tracked over time or by distribution, and grouped by category, format, brand, etailer, or packaging type.
Monitor ingredient penetration across brands, products and markets to identify new opportunities and benchmark your ingredients against key market variables, including dose, variants, branded ingredients and more.
Analyse monthly ingredient penetration by region, country, category and format to inform decisions.
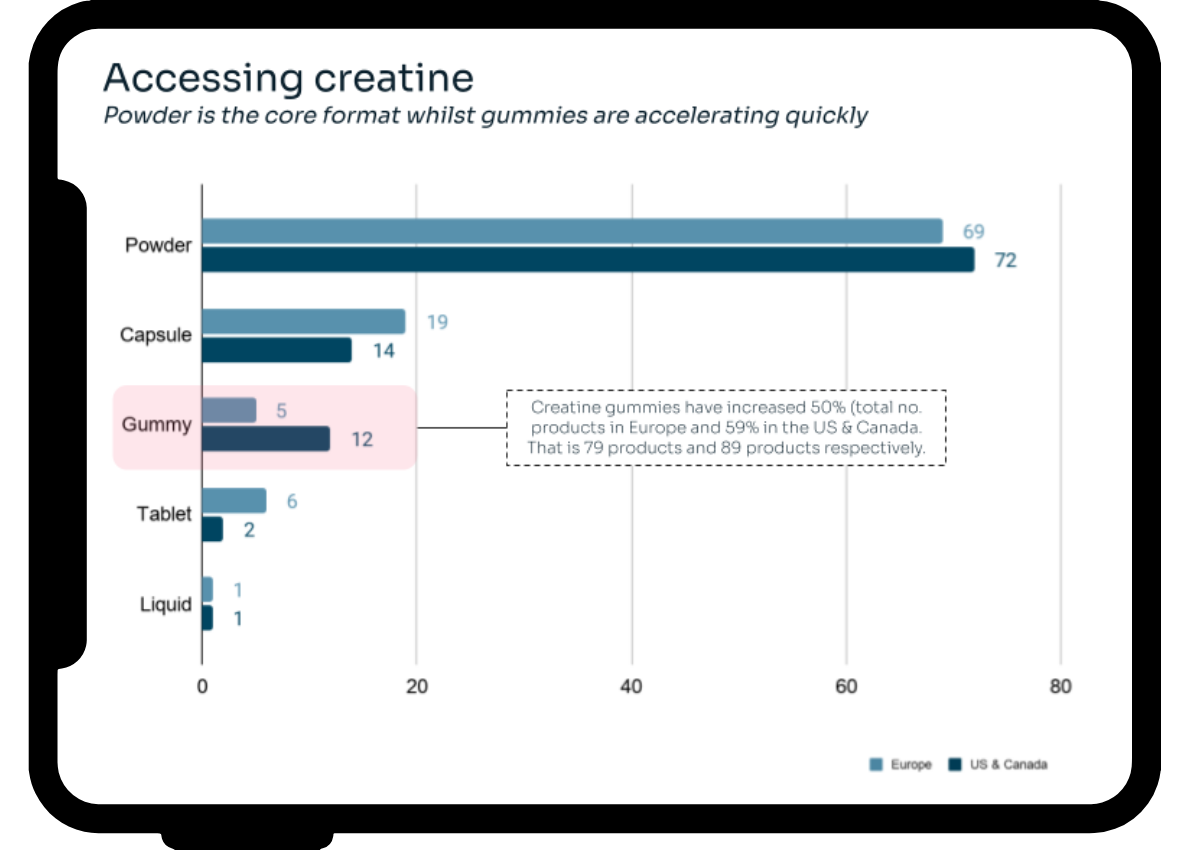
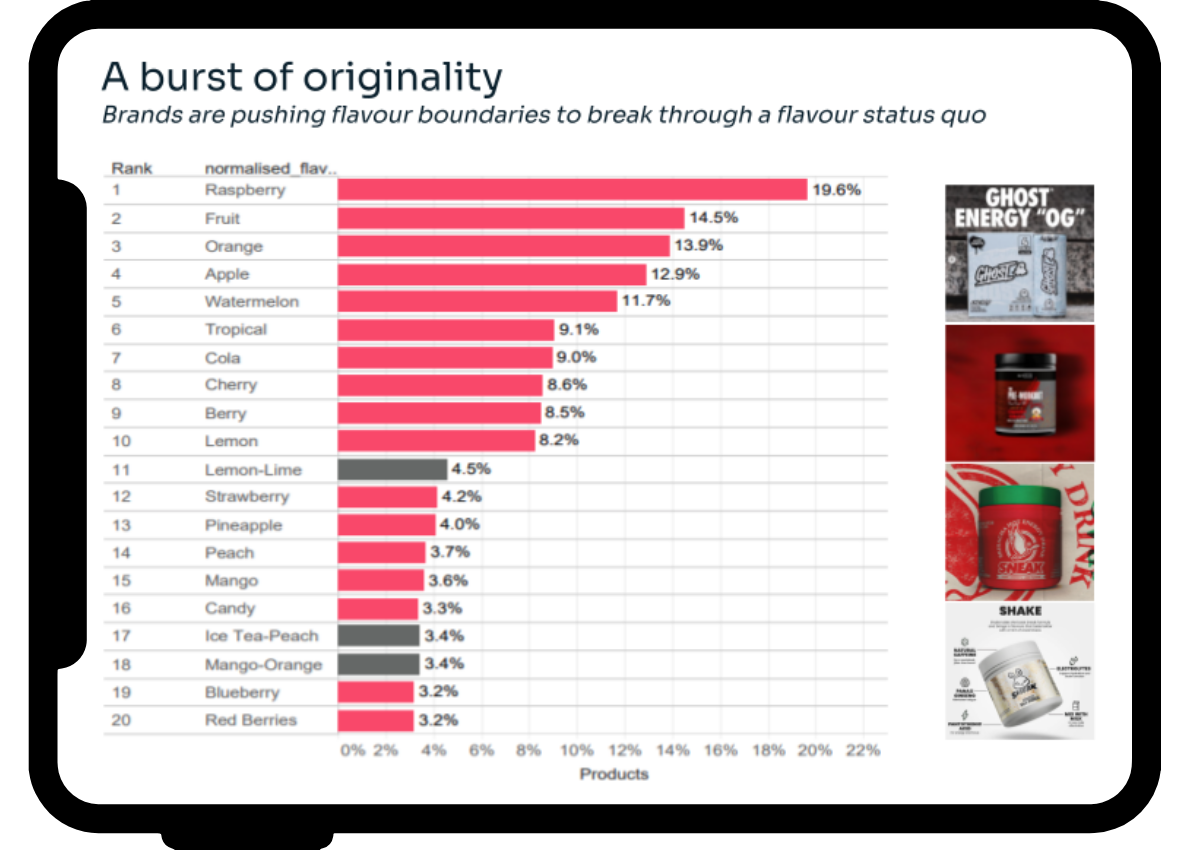
Monitor the flavour trends shaping market, brand and product innovation to identify emerging opportunities, uncover whitespace and stay ahead of shifting consumer dynamics.
Analyse monthly flavour penetration across categories and subcategories, tracking current market status, net change and other key flavour variables to understand where the next opportunities lie.
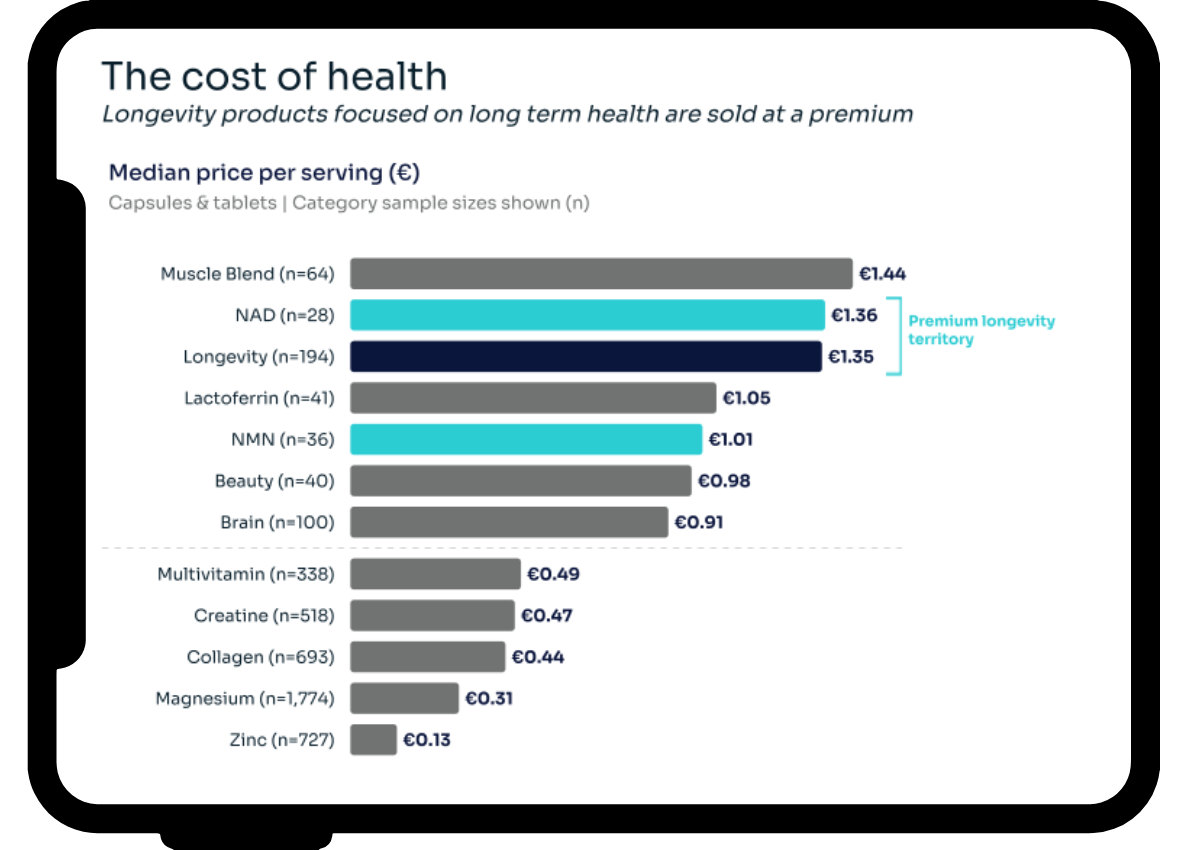
Track category evolution across products, brands and global markets to understand competitive positioning, benchmark competitors and identify the trends driving future growth.
Analyse monthly category changes across nutrient dosing strategies, packaging formats, net product change and other key variables to stay ahead of evolving market dynamics.